Kafka Streams Tools
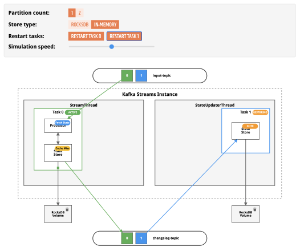
Kafka Streams State Store Simulation
Interactive simulation demonstrating Kafka Streams state store mechanics, changelog topic synchronization, and restoration processes. Understand the relationship between state stores, changelog topics, and tasks. See how RocksDB caching works and explore the difference between StateUpdaterThread and StreamThread.
Open the state store simulation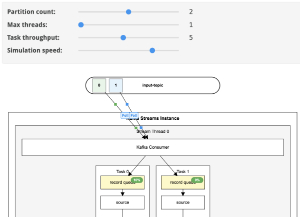
Interactive Kafka Streams Architecture Simulation
This interactive simulation helps you understand the Kafka Streams architecture. See how messages flow through the application, and how partitions and threads impact the message processing.
Open the interactive simulation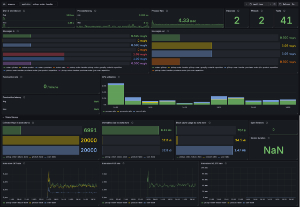
Kafka Streams Grafana Dashboard
Prometheus-based Grafana dashboard that brings together the most important metrics for monitoring Kafka Streams applications. The goal: provide a single view that lets you quickly understand your application’s health and detect issues before diving into more specialized dashboards for investigation.
Learn how to use the dashboard