 Hi! I wrote a Kafka Streams Field Guide, with 8 essential insights. Click here to learn more!
Kafka Streams Grafana Monitoring Dashboard
Building on my Kafka Streams monitoring guide, I’ve created a Prometheus-based Grafana dashboard that brings together the most important metrics for monitoring Kafka Streams applications. The goal: provide a single view that lets you quickly understand your application’s health and detect issues before diving into more specialized dashboards for investigation.
The dashboard is built within the excellent kineticedge/kafka-streams-dashboards showcase stack. The source code is available on GitHub, with plans to contribute it back to the original repository.
Dashboard overview
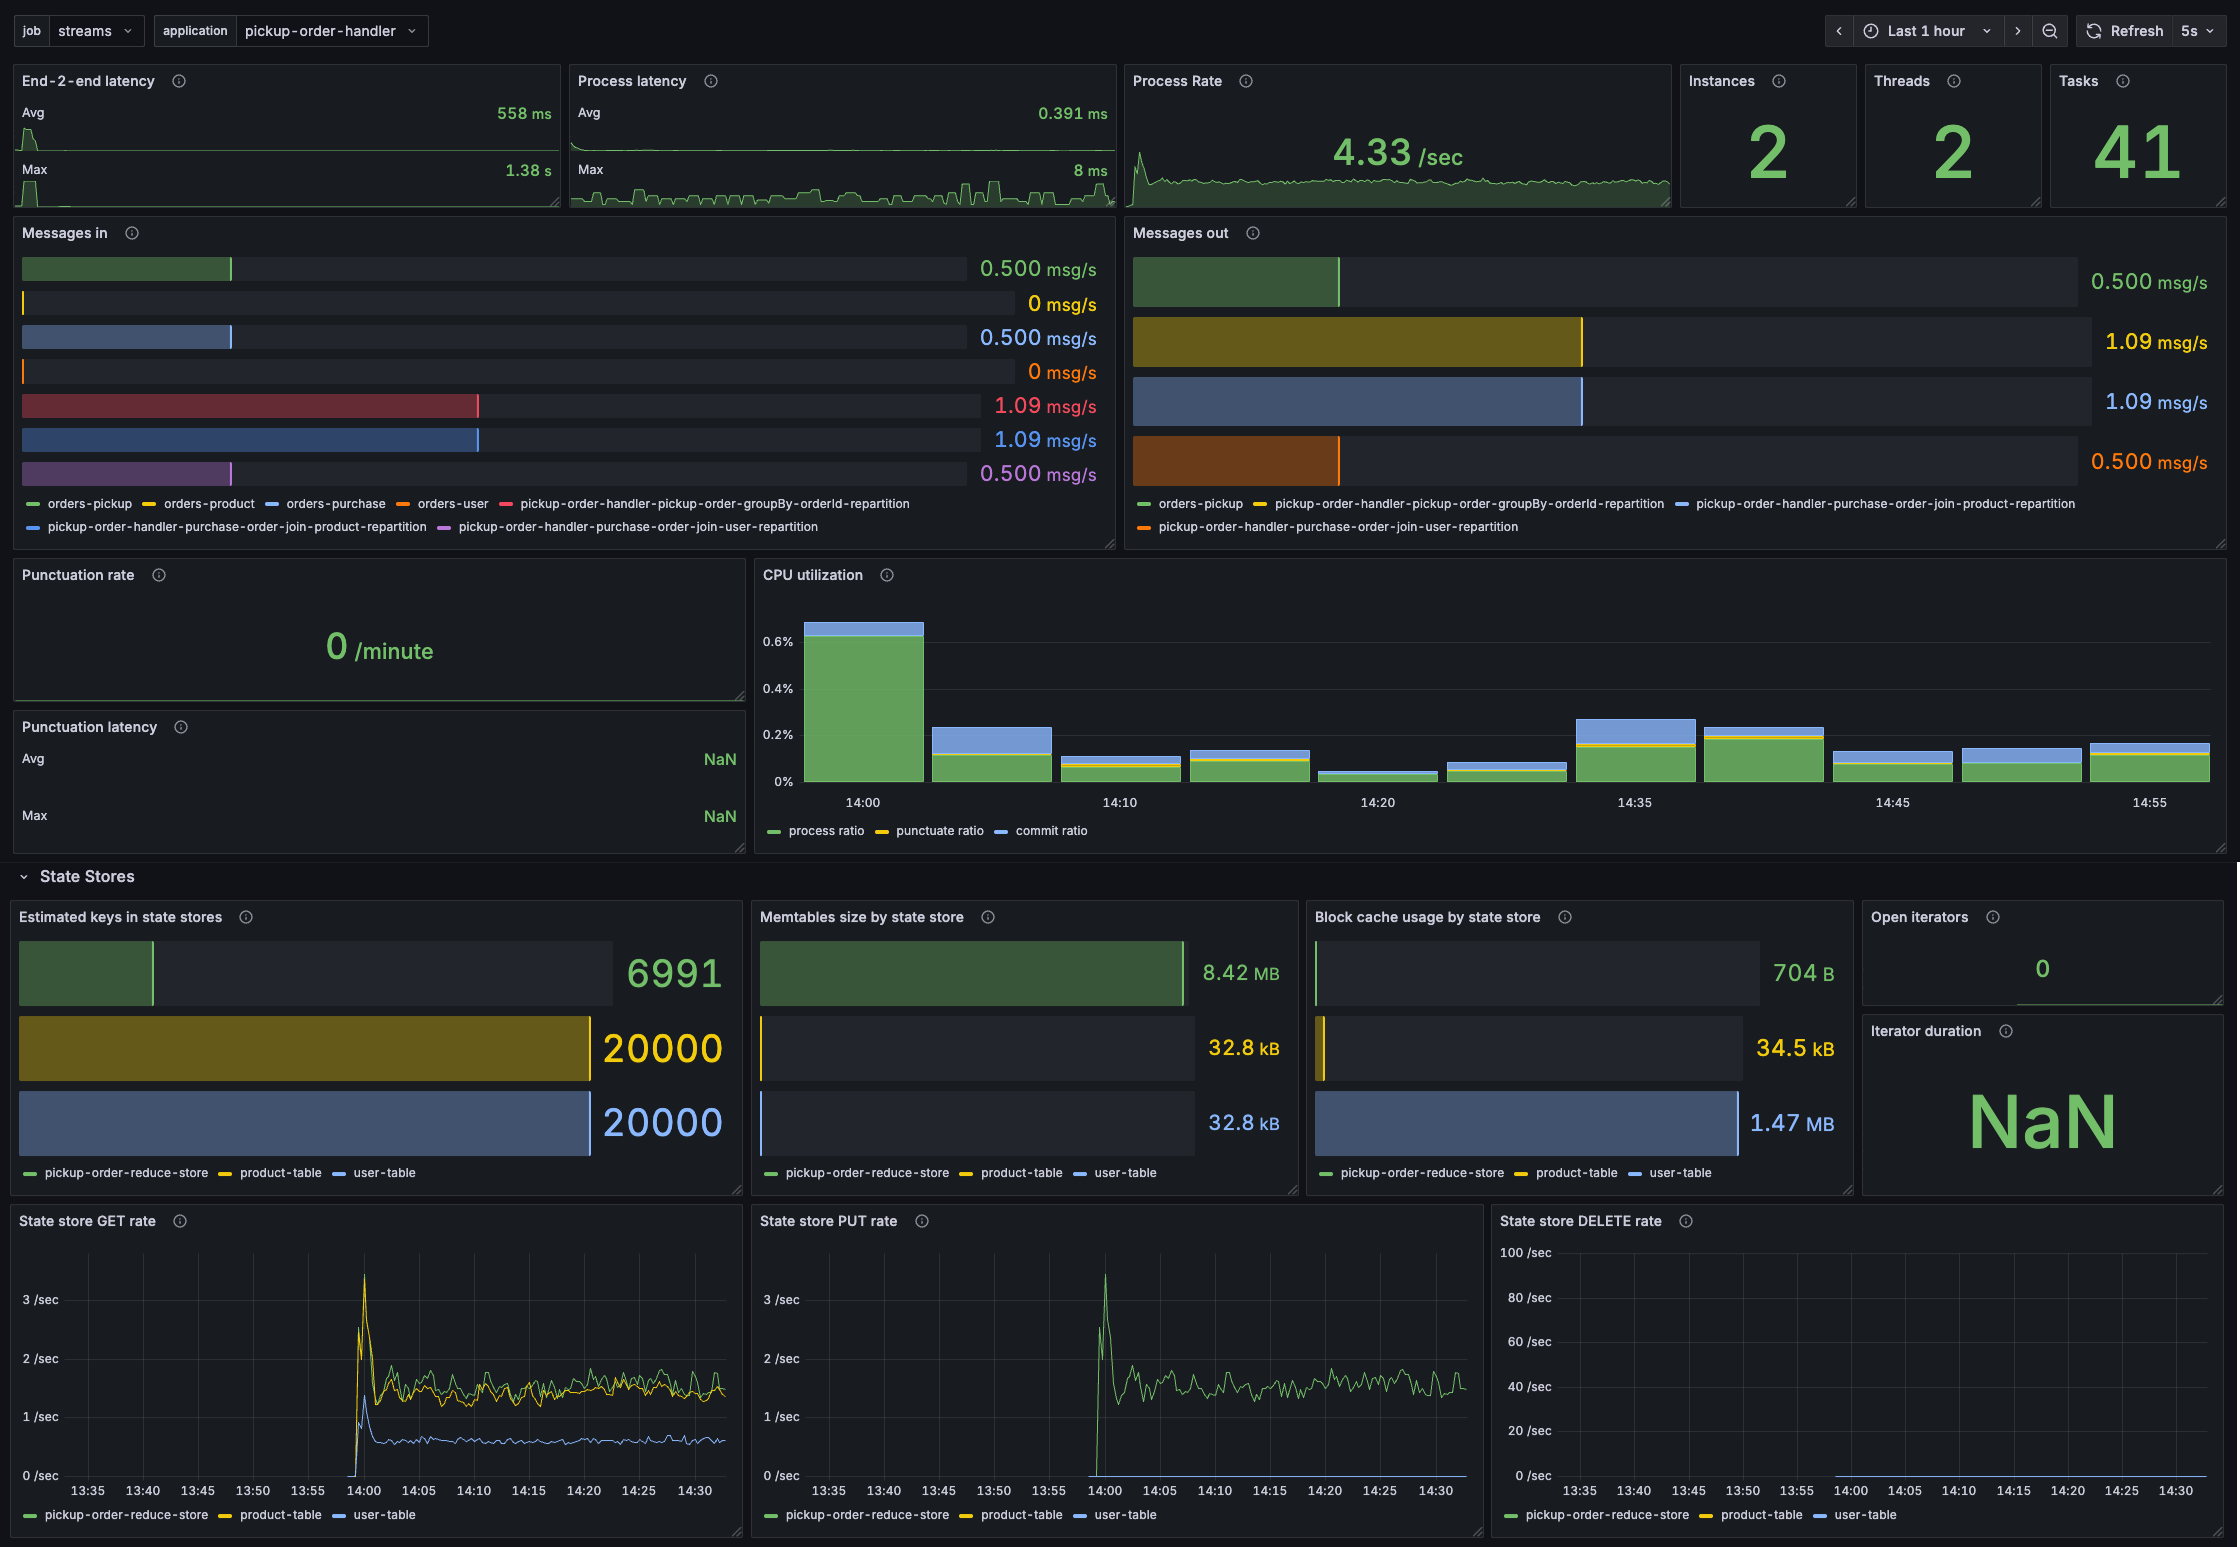
The dashboard adapts to different Kafka Streams applications. Here’s what it looks like for a stateful order processing application:
And for a simpler analytics application that uses punctuators:
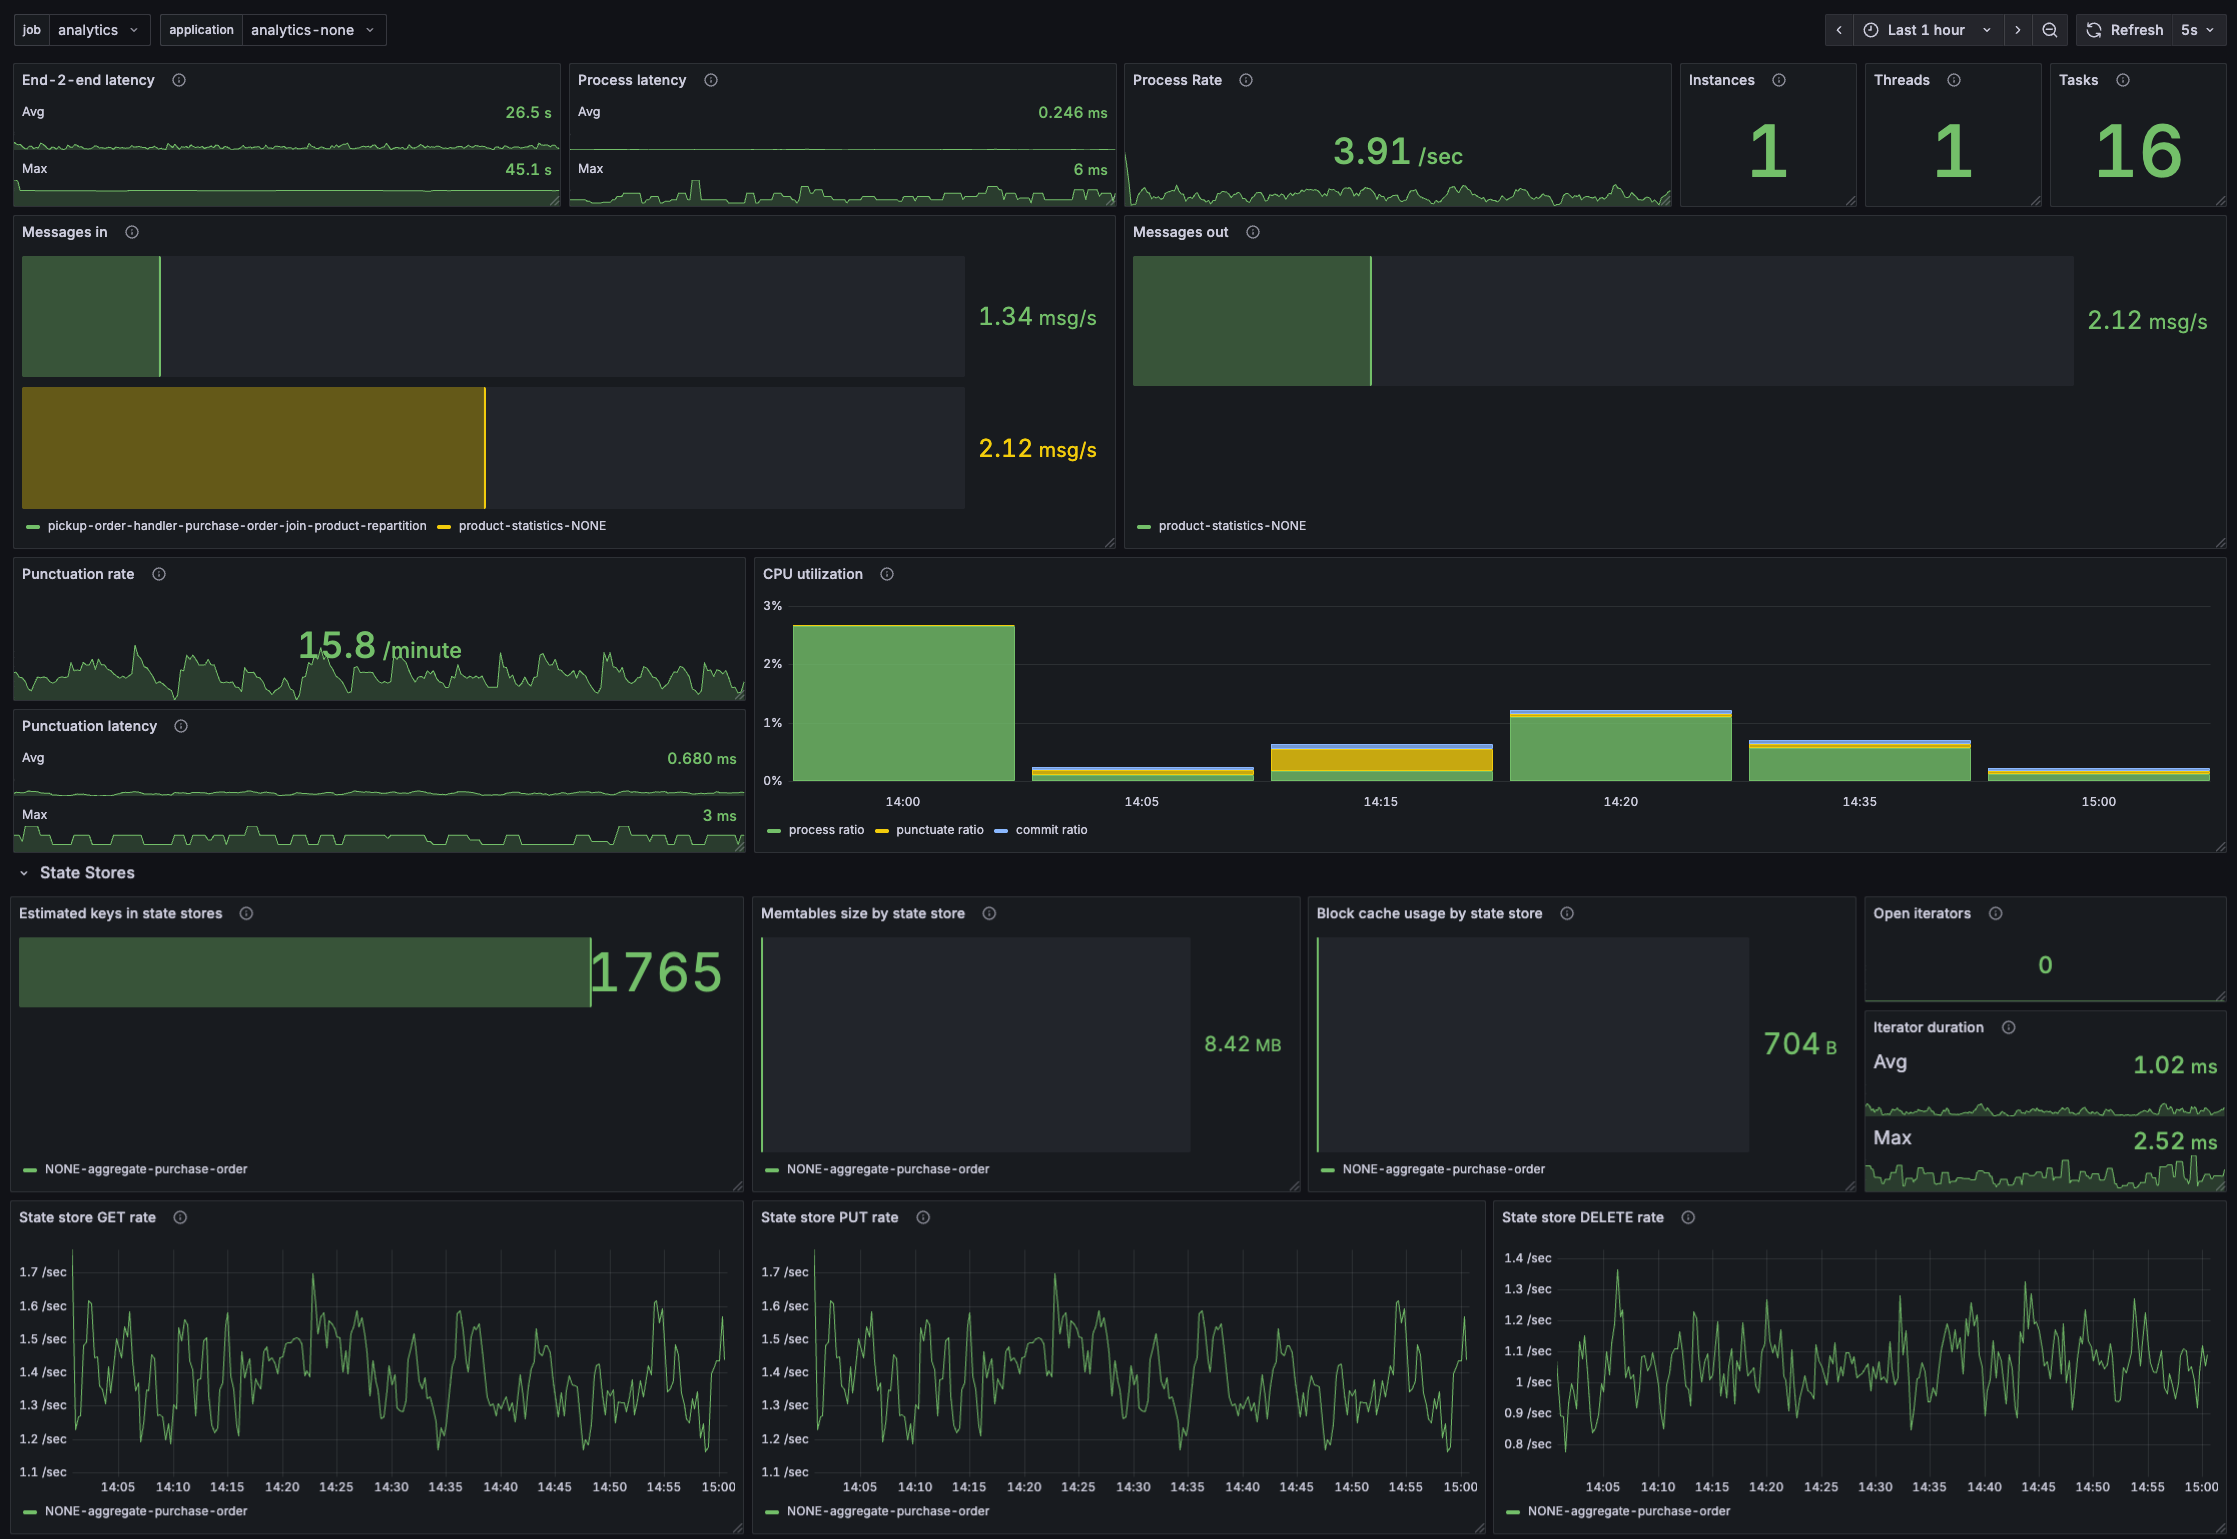
The dashboard uses dropdown filters to select your Kafka Streams job and application, making it easy to switch between different deployments.
Let’s explore the various parts of the dashboard and learn how to interpret them.
Processing metrics
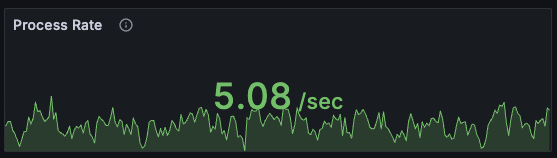
The top row provides immediate visibility into processing performance:
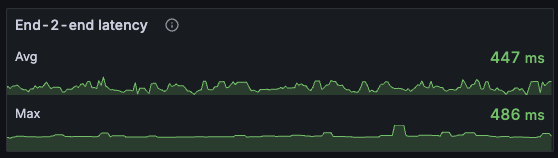
End-to-end latency: Shows how long it takes to process records as perceived by users. This is the difference between the record timestamp and when it was fully processed. High values indicate either processing bottlenecks or that your application is lagging behind.
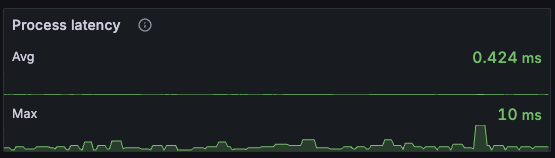
Process latency: The execution time to process records within Kafka Streams. If this is high, investigate your processing logic for inefficiencies.
Process rate: How many records per second your application is processing. Use this to understand throughput and spot processing stalls.
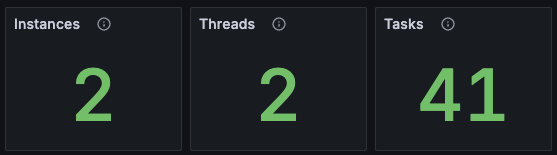
Instances, Threads & Tasks
Quick overview of your deployment.
Message flow
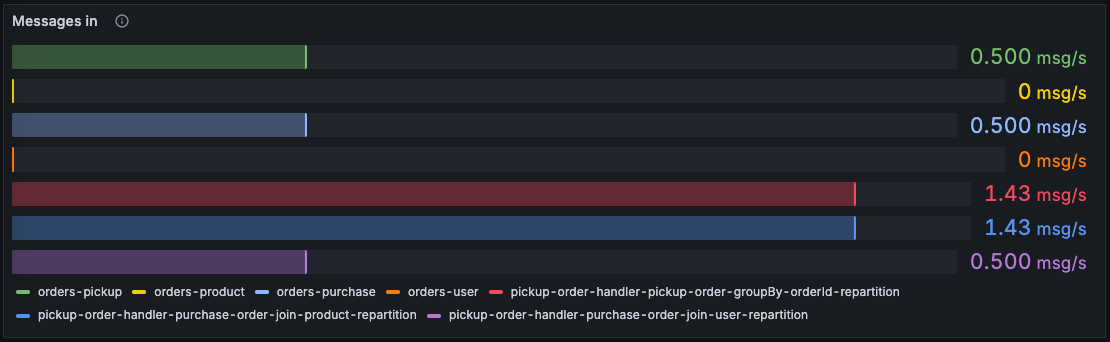
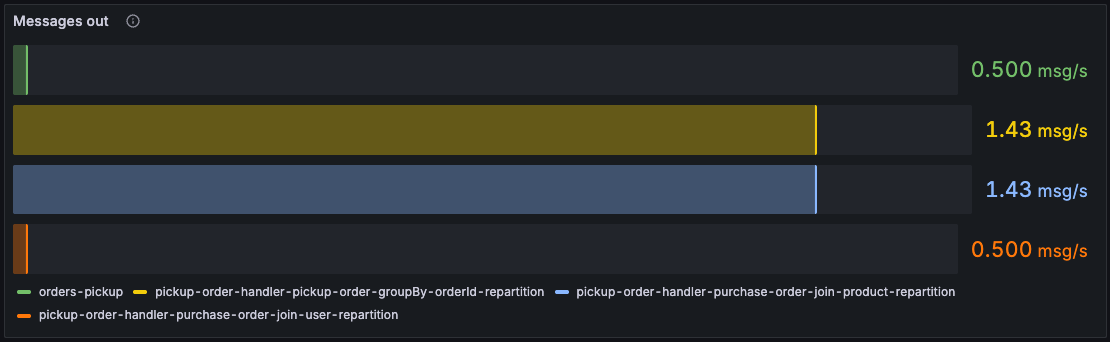
These horizontal bar charts show message rates per topic, color-coded to distinguish between different topics. The left panel shows messages consumed, the right shows messages produced. This helps you:
- Identify which topics are being used by your Kafka Streams application
- Verify expected data flow patterns
- Identify bottlenecks where input/output rates diverge
- Spot topics with unusual activity
Punctuators
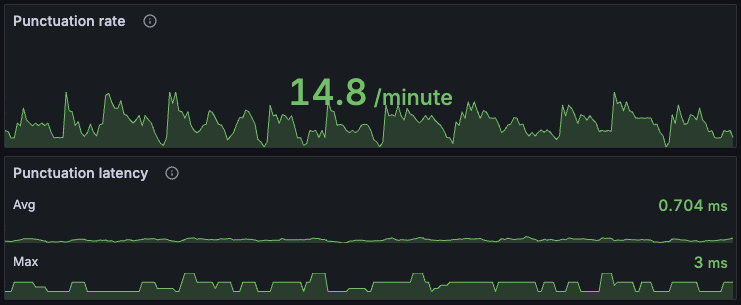
If your application uses punctuators, these panels become valuable. Punctuation rate shows how frequently punctuators execute. Punctuation latency reveals how long they take.
For efficient processing, punctuators should take up a small fraction of processing time. If punctuation latency is consistently high or the punctuate ratio in the CPU utilization panel exceeds 20%, investigate whether your punctuators are doing too much work.
CPU utilization
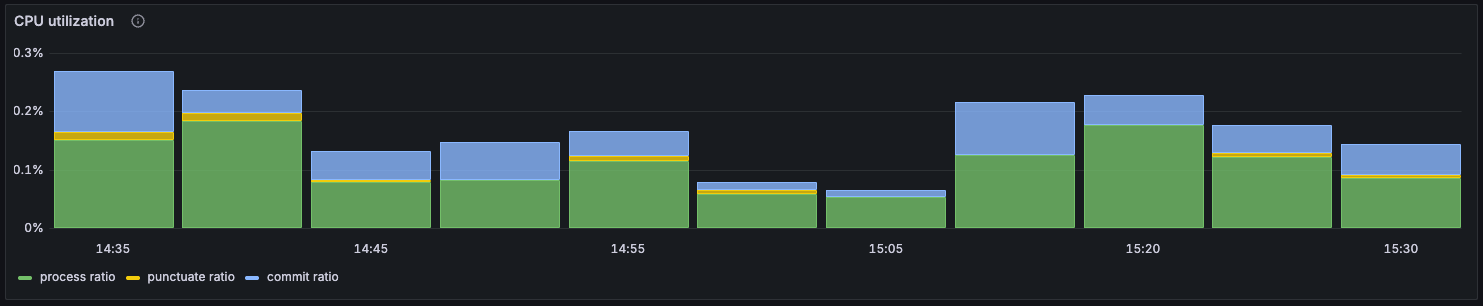
This stacked bar chart breaks down how each thread spends its time:
- Process ratio (green): fraction of time processing records
- Punctuate ratio (yellow): fraction of time executing punctuators
- Commit ratio (blue): fraction of time committing offsets
The remaining white space represents the poll ratio - time spent idling while waiting for new records. Higher poll ratio means your application has breathing room.
A high process ratio (above 80%) might look efficient but warrants investigation - it could indicate inefficient code. An elevated commit ratio suggests communication issues with the Kafka cluster.
State store metrics
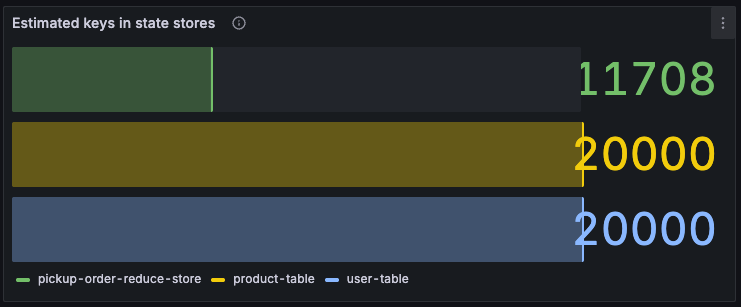
Estimated keys shows the number of records in each state store. Use this to track state store growth and identify unbounded state accumulation.
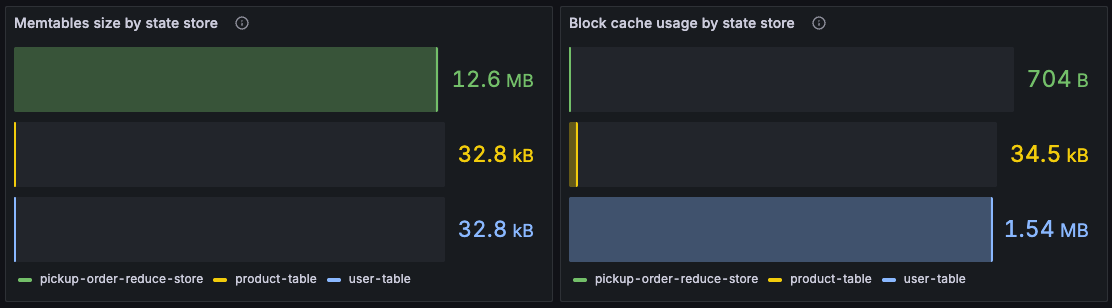
For RocksDB state stores, these metrics reveal off-heap memory usage.
- Memtables: RocksDB buffers writes into memtables (default: 3 × 16MB = 48MB per RocksDB store). If this reaches the maximum consistently, you may experience performance issues with flushing to disk.
- Block cache: Used for read operations (default: 50MB per RocksDB store). If this consistently maxes out, consider increasing it for better read performance, but watch out for OOM issues as this is off-heap memory.
Important: The memtable sizes and block cache usage are totals per Kafka Streams state store. For every Kafka Streams state store, there might be multiple RocksDB instances.
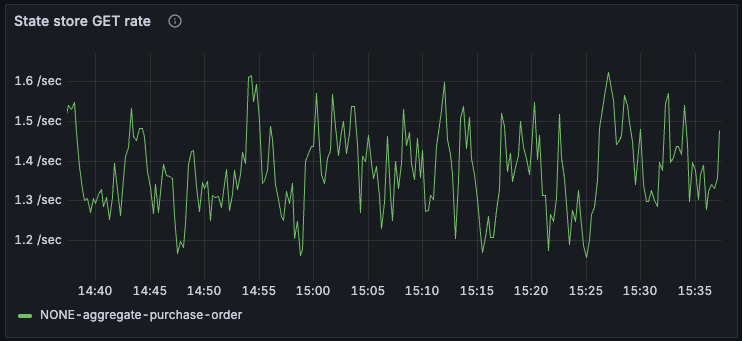

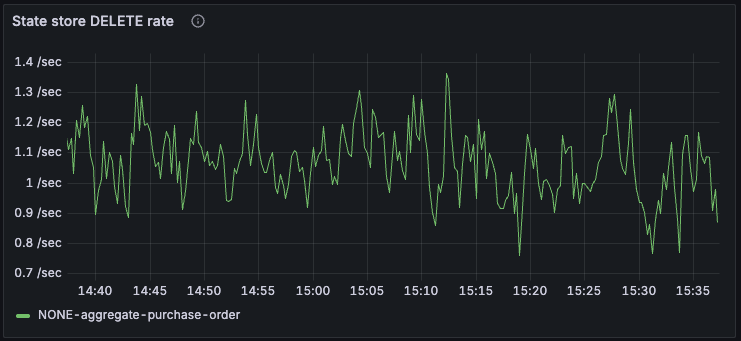
These time series show the rate of state store operations: GET, PUT, and DELETE. Use them to understand state store activity patterns and identify unexpected spikes.
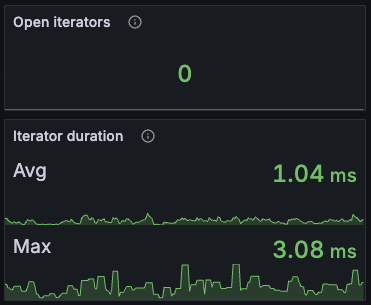
Open iterators: The number of state store iterators currently open. If this keeps increasing, you likely have a memory leak where iterators aren’t being closed in your code.
Iterator duration: How long iterators remain open. Long-lived iterators might indicate inefficient traversals or processing too many records at once.
Try out the dashboard
Because this dashboard leverages the awesome kineticedge/kafka-streams-dashboards stack, it’s very easy to try it out.
Follow the instructions in the README to deploy the stack and try it out. It’s just one command.
Configuration notes
When adapting this dashboard to your deployment, keep in mind:
-
Metric prefix: The dashboard assumes Kafka Streams metrics use the
kafka_streamprefix (e.g.,kafka_stream_task_process_rate). Adjust queries if you use a different prefix. -
Variables: The dashboard uses four variables - two visible (job, application) and two hidden (instance, thread). The queries behind these might need tweaking depending on how you expose Kafka Streams metrics.
-
Data source: Built for Prometheus. If you use a different metrics backend, you’ll need to update the data source in each panel and potentially adapt the PromQL queries.
-
Recording levels: Several metrics require the
debugrecording level. Make sure your Kafka Streams application is configured withmetrics.recording.level=debugto see all panels populate.
Using the dashboard
This dashboard is designed as your starting point for monitoring. When you spot something unusual - high latency, unexpected message flow, growing state stores - switch to more specialized dashboards.
The dashboard works best when combined with consumer lag monitoring and log-based alerts, as covered in my Kafka Streams monitoring guide. Together, these give you comprehensive visibility into your Kafka Streams applications.
Insight 1: Partitioning Strategy
How to size your topics, optimize message distribution, ensure ordering guarantees, and handle co-partitioning and repartitioning.
Insight 2: Rebalance Tuning
Understand warmup tasks and how they impact rebalances. Learn to configure them to reach stable, higher throughput faster.
No fluff. Just straightforward advice and deep insights to improve your Kafka Streams application's performance.