 Hi! I wrote a Kafka Streams Field Guide, with 8 essential insights. Click here to learn more!
Kafka Streams Monitoring guide
Kafka Streams metrics
Metrics are the cornerstone of monitoring. Kafka Streams comes with numerous built-in metrics. I’m going to highlight some I recommend as a base for monitoring Kafka Streams. There are a lot of other metrics, but typically I only use those after the base metrics show signs of issues.
Kafka Streams has three recording levels for metrics: info, debug and trace. Make sure you’ve configured the correct recording level depending on which metrics you want to monitor. You can configure the recording level using the metrics.recording.level property in your Kafka Streams application configuration.
metrics.recording.level="info"stream-thread-metrics
- process-latency-avg and process-latency-max: execution time to process records. Recorded at info level.
- poll-ratio: fraction of time the thread spent polling for new records. Higher is better, as this means your application has breathing room to idle.
- process-ratio: fraction of time spent processing new records. A high process ratio (above 80%), while looking efficient, might warrant investigation. It might indicate inefficient code.
- punctuate-ratio: fraction of time spent executing punctuators. For efficient processing, you want most of the processing to go to new messages, and punctuators only to take up a small fraction of the time. If this ratio is higher than 20%, then I’d certainly investigate this.
- commit-ratio: fraction of time spent committing offsets. This ratio should be minimal. If increased, it might indicate communication issues with the Kafka cluster.
- punctuate-rate: average number of punctuations per second by all tasks in this thread. Recorded at info level.
- punctuate-latency-avg: average execution time of punctuators. Can detect punctuators that are too heavy. Recorded at info level.
stream-task-metrics
- process-rate: how many records are being processed per second. Recorded at debug level.
- dropped-records-rate: how many records are being dropped per second. Records can be dropped when an exception handler ignores the message. (More on error handling in my Kafka Streams Field Guide). Recorded at info level.
stream-processor-node-metrics
- record-e2e-latency-avg and record-e2e-latency-max: Really interesting metrics that show you how long it takes to process a record as perceived by users. It’s the difference between the record timestamp and the time at which the record was fully processed by the Kafka Streams processor node. So it shows not only how long it took for Kafka Streams to process the record, but also how long it took for Kafka Streams to pick up the record. Recorded at info level.
stream-state-metrics
- put-rate, get-rate and delete-rate: shows you most of the activity on the state store. Recorded at debug level.
- num-open-iterators: The current number of iterators on the store that have been created, but not yet closed. If this keeps going up, then you probably didn’t close a state store iterator in your code and have a memory leak. Recorded at info level.
- iterator-duration-avg and iterator-duration-max: How long a state store iterator remained open. When an iterator remains open for a long time, it’s worth investigating. It might mean the iterator is traversing too many records or doing it inefficiently. Recorded at debug level.
- estimate-num-keys: estimated number of records in the state store. Helps you track the size of the state store. Recorded at debug level.
- size-all-mem-tables: off-heap memory used for RocksDB’s memtables. RocksDB buffers writes into these memtables as new records are put into the state store. Every store by default has 3 active memtables, of 16MB each. These memtables get flushed as they fill up. When this metric reaches the maximum (48MB for all 3 memtables combined), there might be performance issues with flushing the memtables to disk. Recorded at debug level.
- block-cache-usage: off-heap memory used for RocksDB’s block cache. This cache is used by RocksDB to efficiently process read requests, without having to read data from disk. If this value reaches the default of 50MB per store, then you might have to increase it for better read performance. When increasing it, watch out for the memory configuration of your server/container to avoid OOM issues, as this is off-heap memory. Recorded at debug level.
Exporting Kafka Streams metrics
Now how can you get these metrics into your monitoring stack? If you’re using Prometheus to gather and store metrics, there are two ways:
- Export Kafka Streams metrics through JMX and expose them with the Prometheus JMX Exporter. Requires no code changes to your Kafka Streams application, only to its deployment.
- Export Kafka Streams metrics using Micrometer with its Kafka binding and the Prometheus metrics registry implementation. Requires code changes in your Kafka Streams bootstrap code.
This excellent article by Zeinab Dashti explains how to implement both approaches.
Metric dashboards
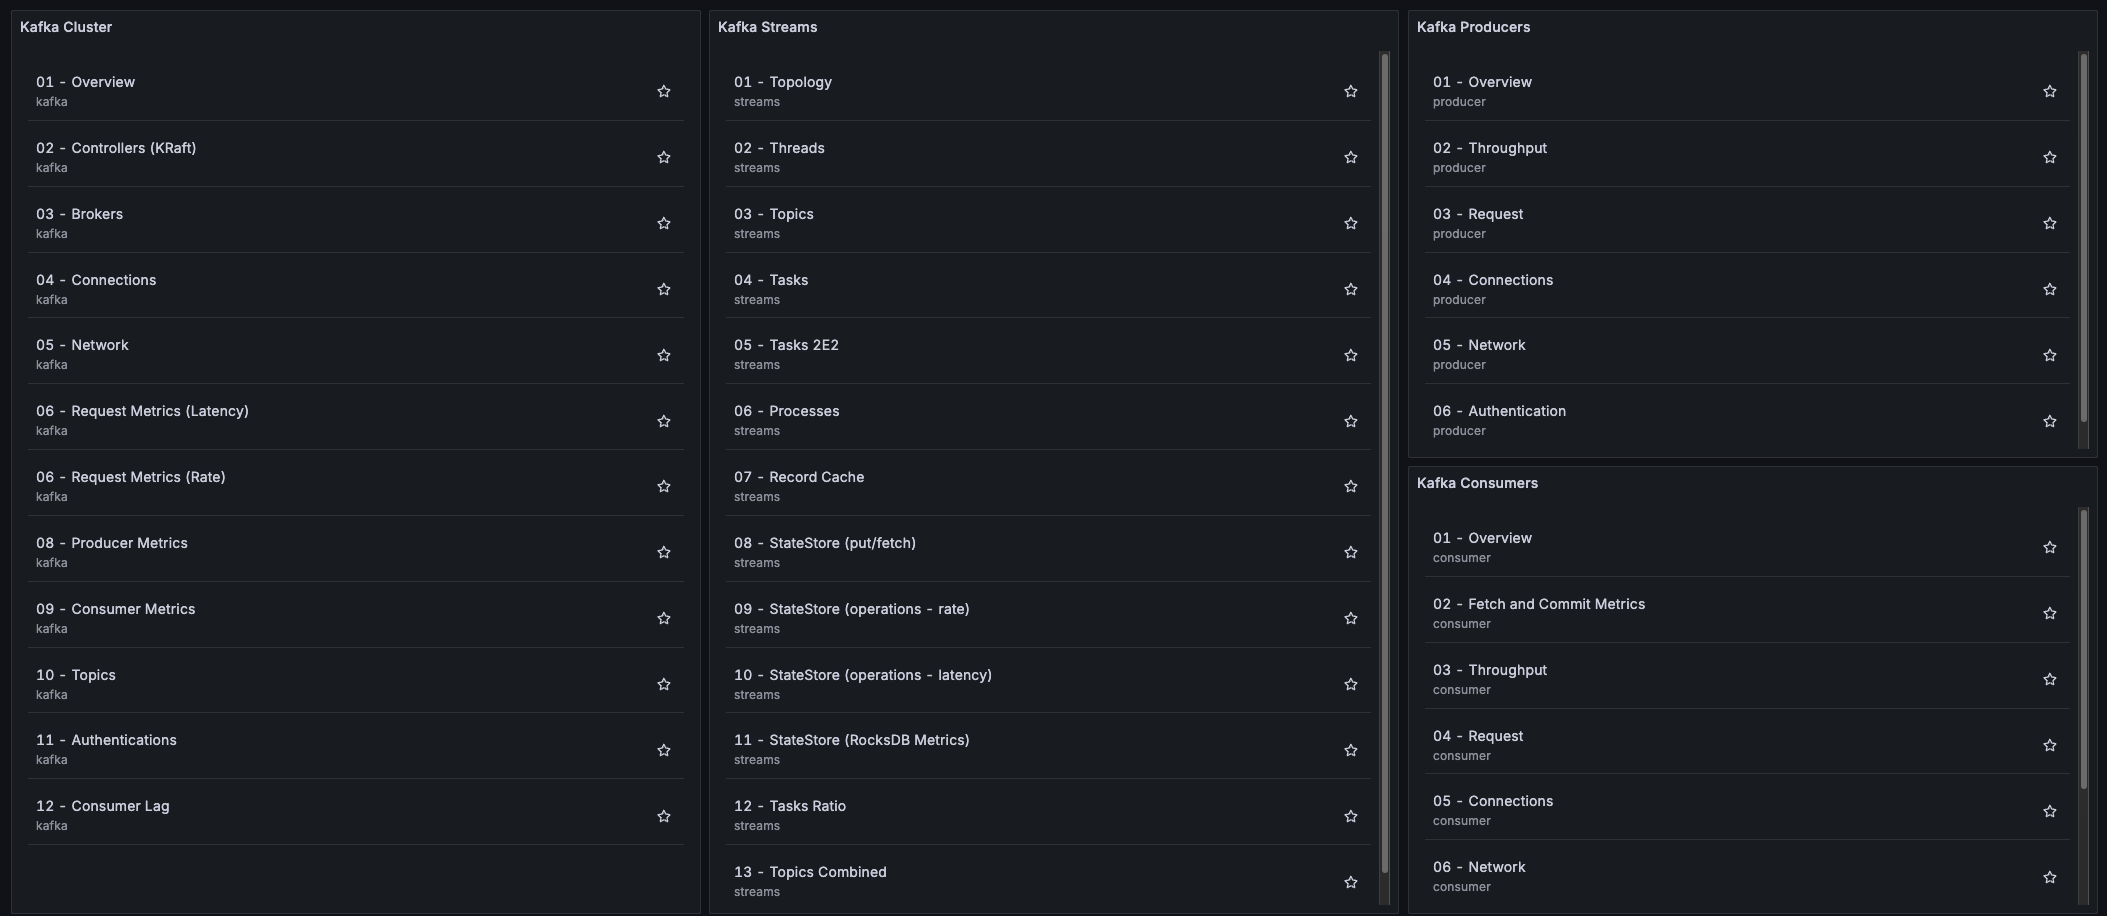
If you’re using Grafana in your monitoring stack, then you’re in luck! There’s this awesome kineticedge/kafka-streams-dashboards project which showcases a bunch of Grafana dashboards for Kafka Streams. These are quality dashboards that come with useful dropdown menus to drill down on the thread, task, topic, store, etc. The number of dashboards on display here is quite incredible, and it’s not even limited to Kafka Streams; it also includes dashboards with cluster, consumer and producer metrics. And the crazy thing: it’s a Docker Compose stack you can try out yourself! Run the startup script as mentioned in the project’s README and start exploring it.
The stack is based on Prometheus + Grafana. To get the metrics into Prometheus, it uses:
- Micrometer with the Kafka binding and the Prometheus metrics registry implementation to instrument the Kafka Streams application
- Kafka Exporter to export Kafka cluster metrics (including consumer group lag!) to Prometheus
Here’s an impression of some of the Kafka Streams dashboards.
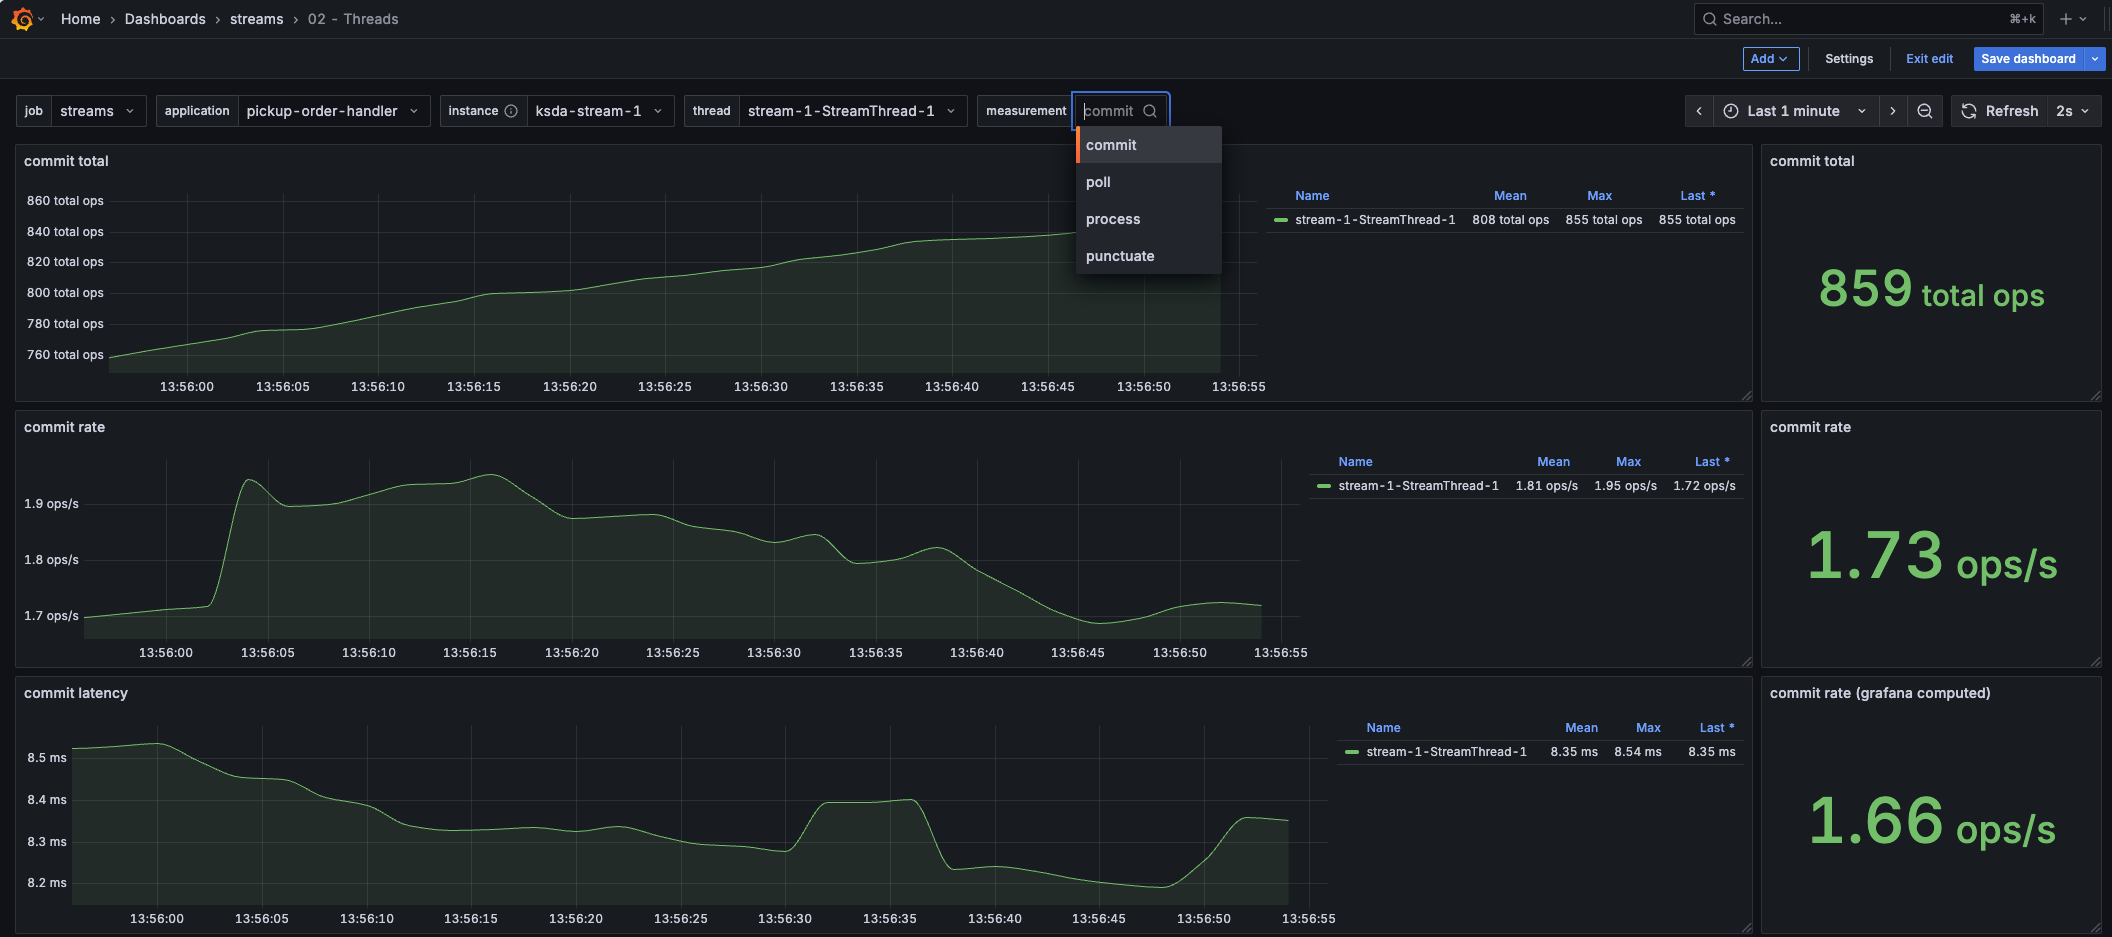 This dashboard provides insights into the commit, poll, process and punctuator metrics of a thread.
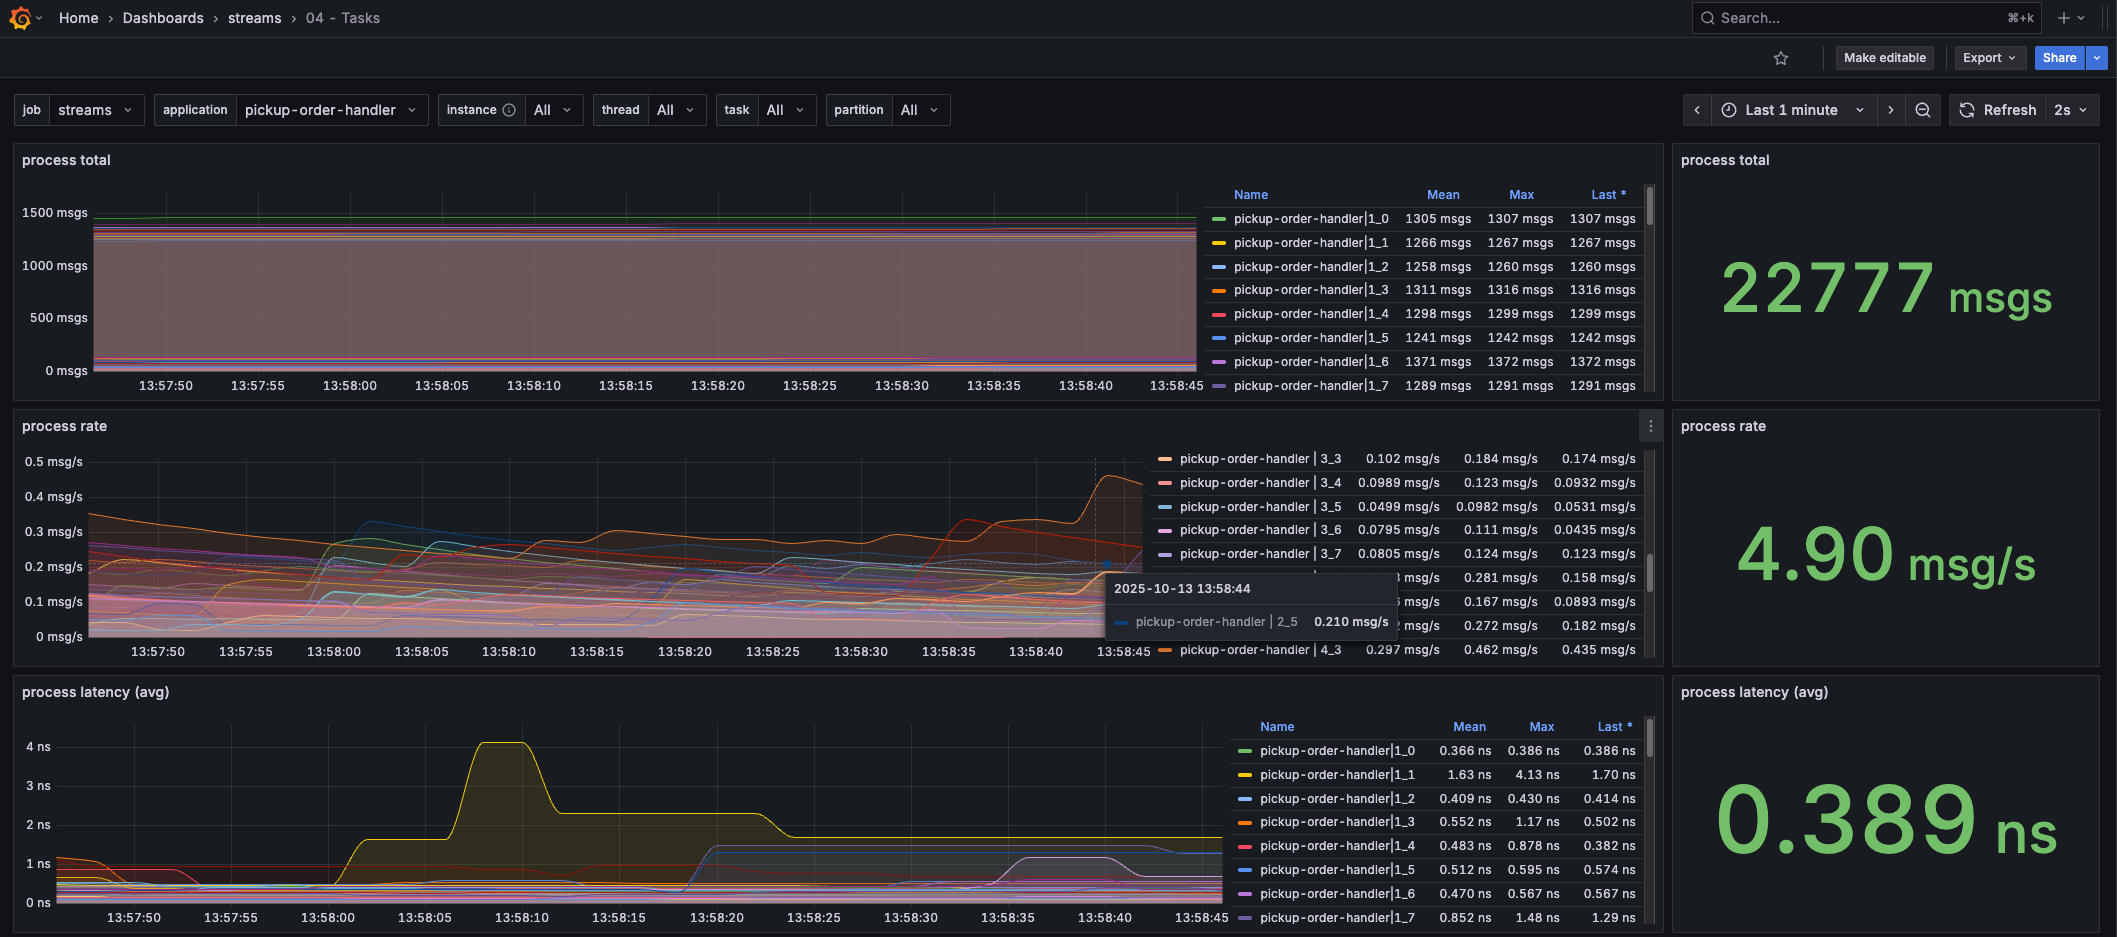 This dashboard provides insights into the processing rate/latency of the tasks.
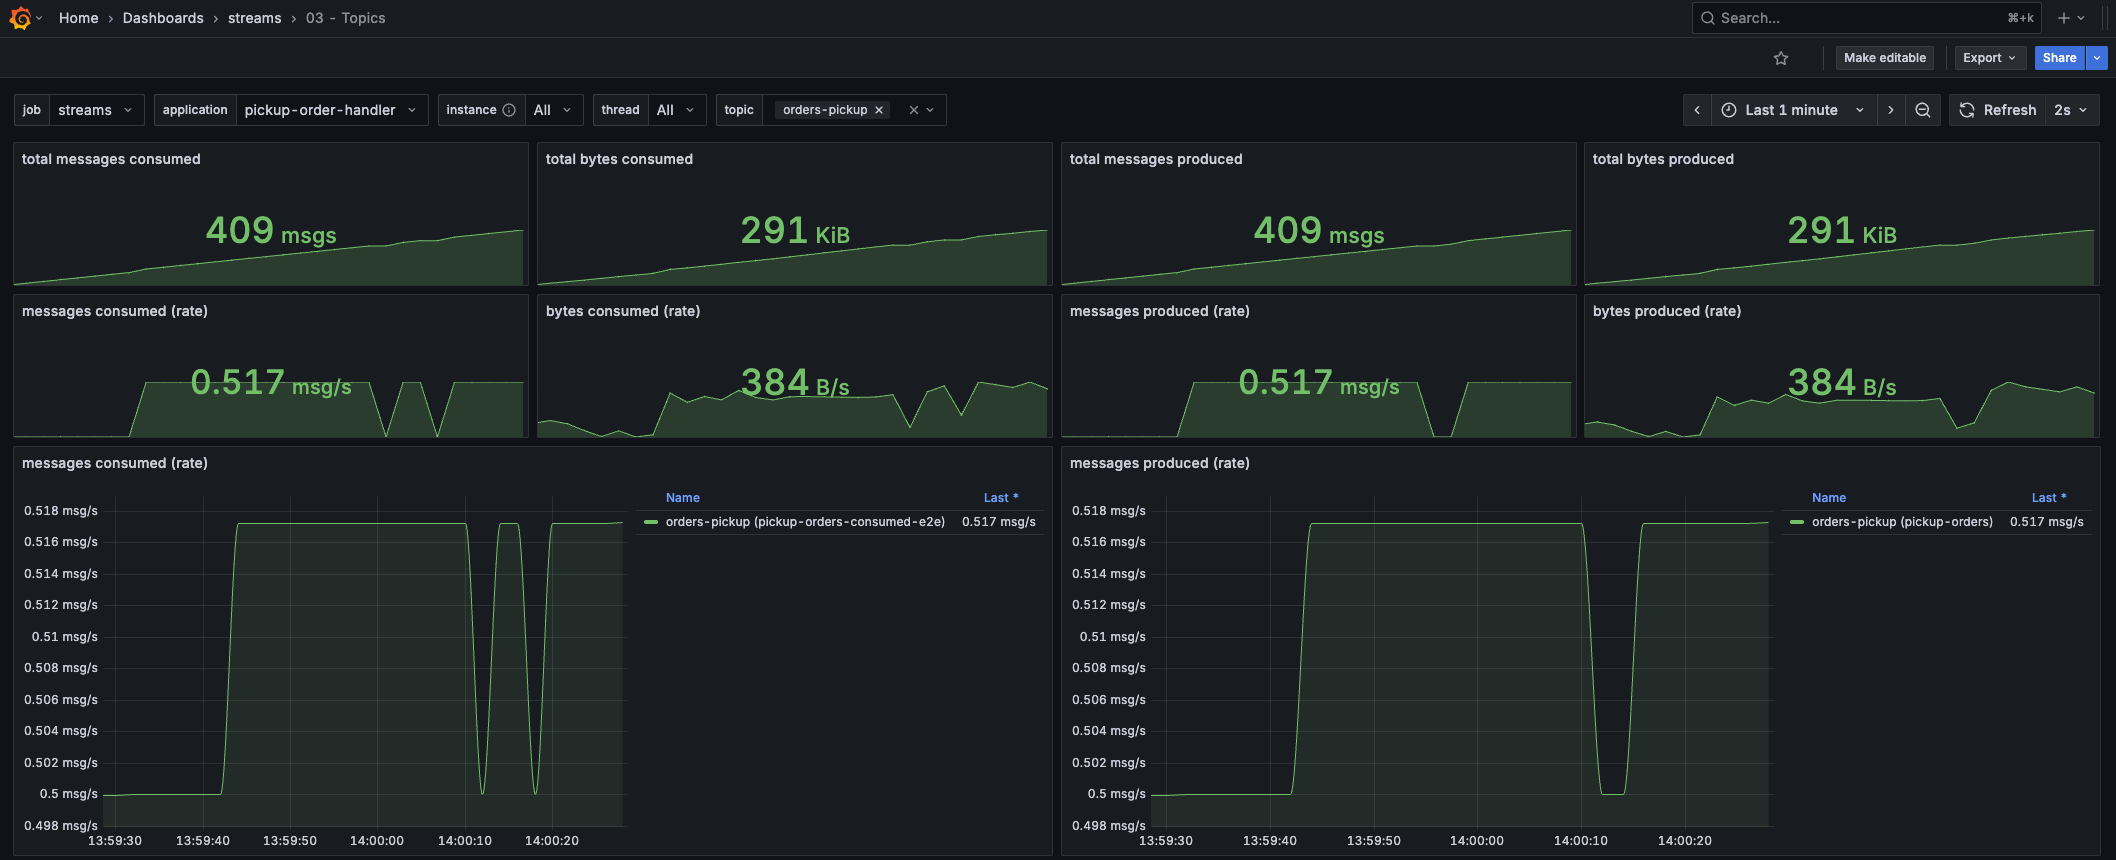 Want to know how many messages your Kafka Streams application is publishing/consuming from a certain topic? This dashboard lets you select the Streams application and topic, and shows you how much data is being consumed and produced.
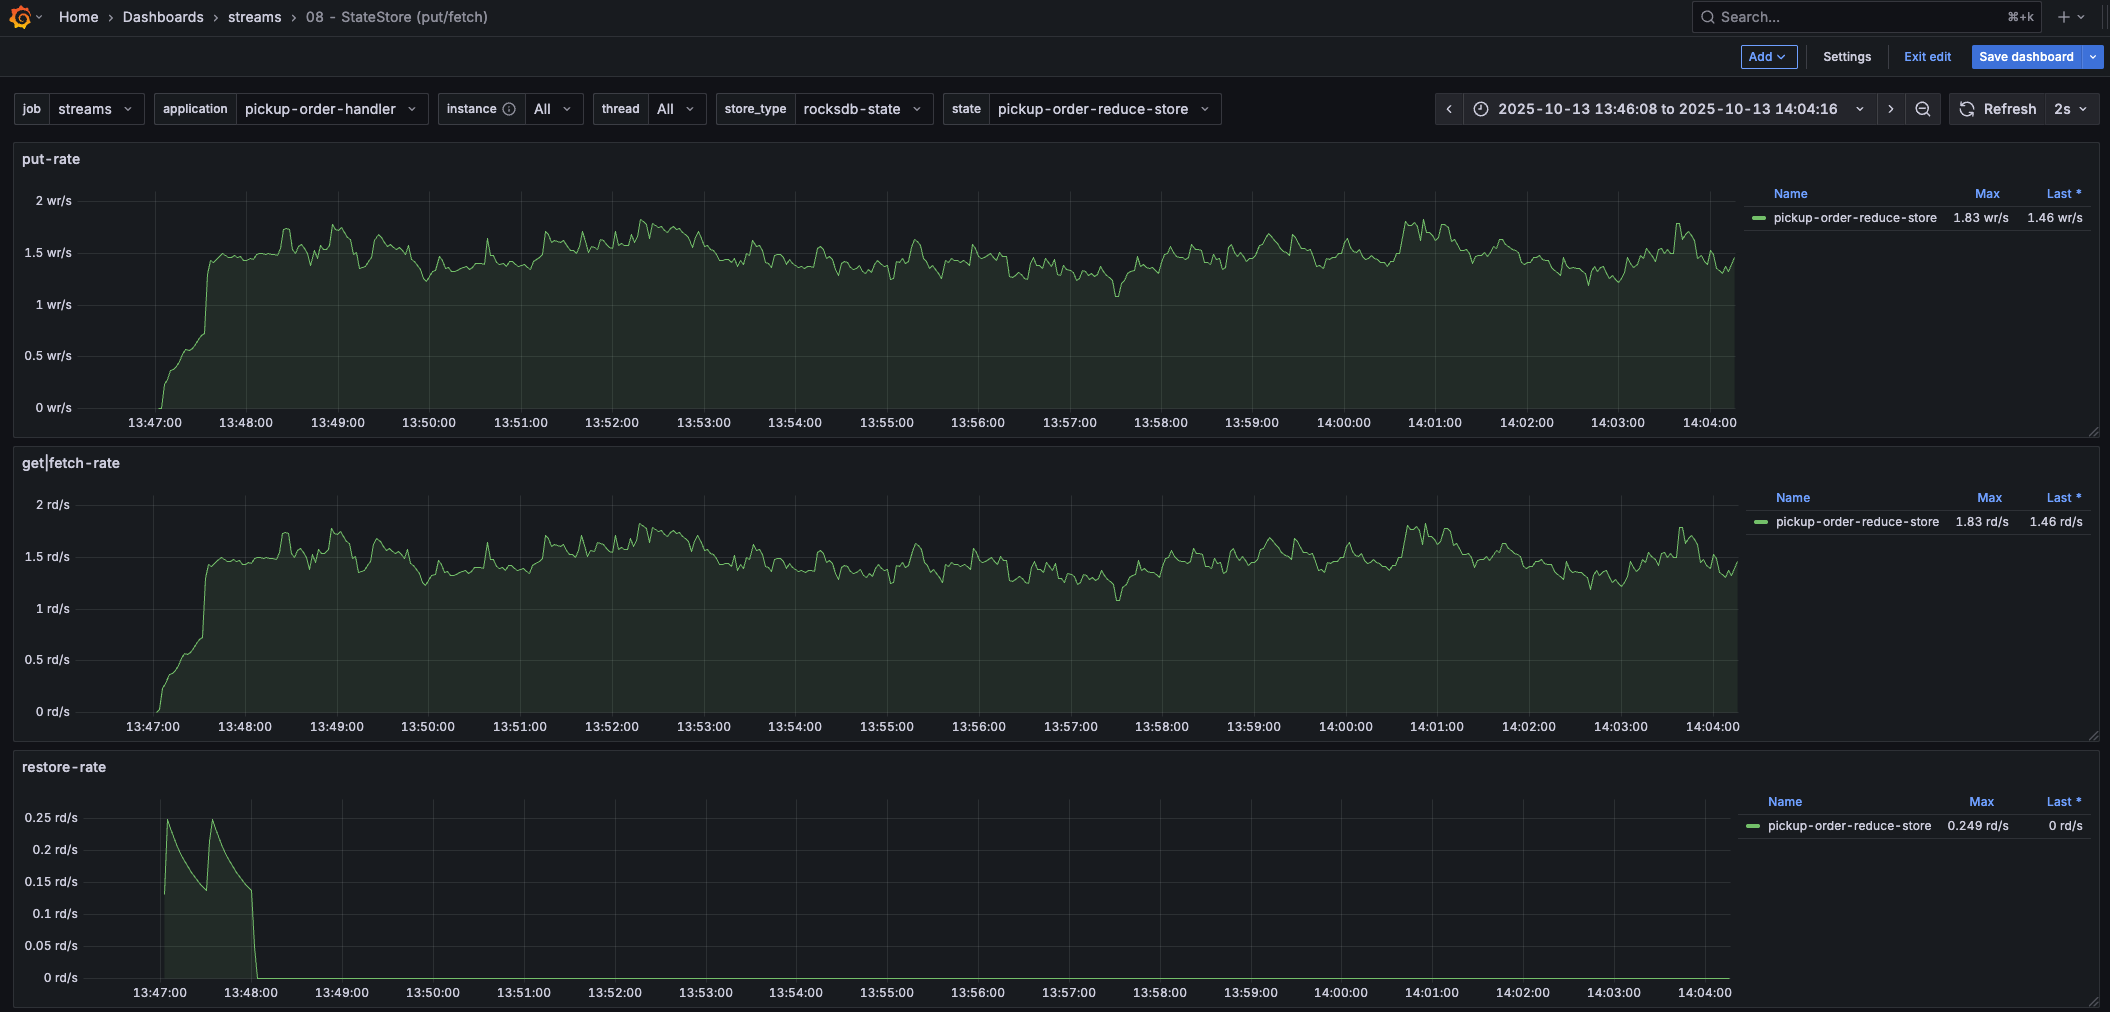 This is only one of the state store related dashboards. It shows the put/fetch rate of a state store, including the restore rate (which is interesting when applications are starting up).
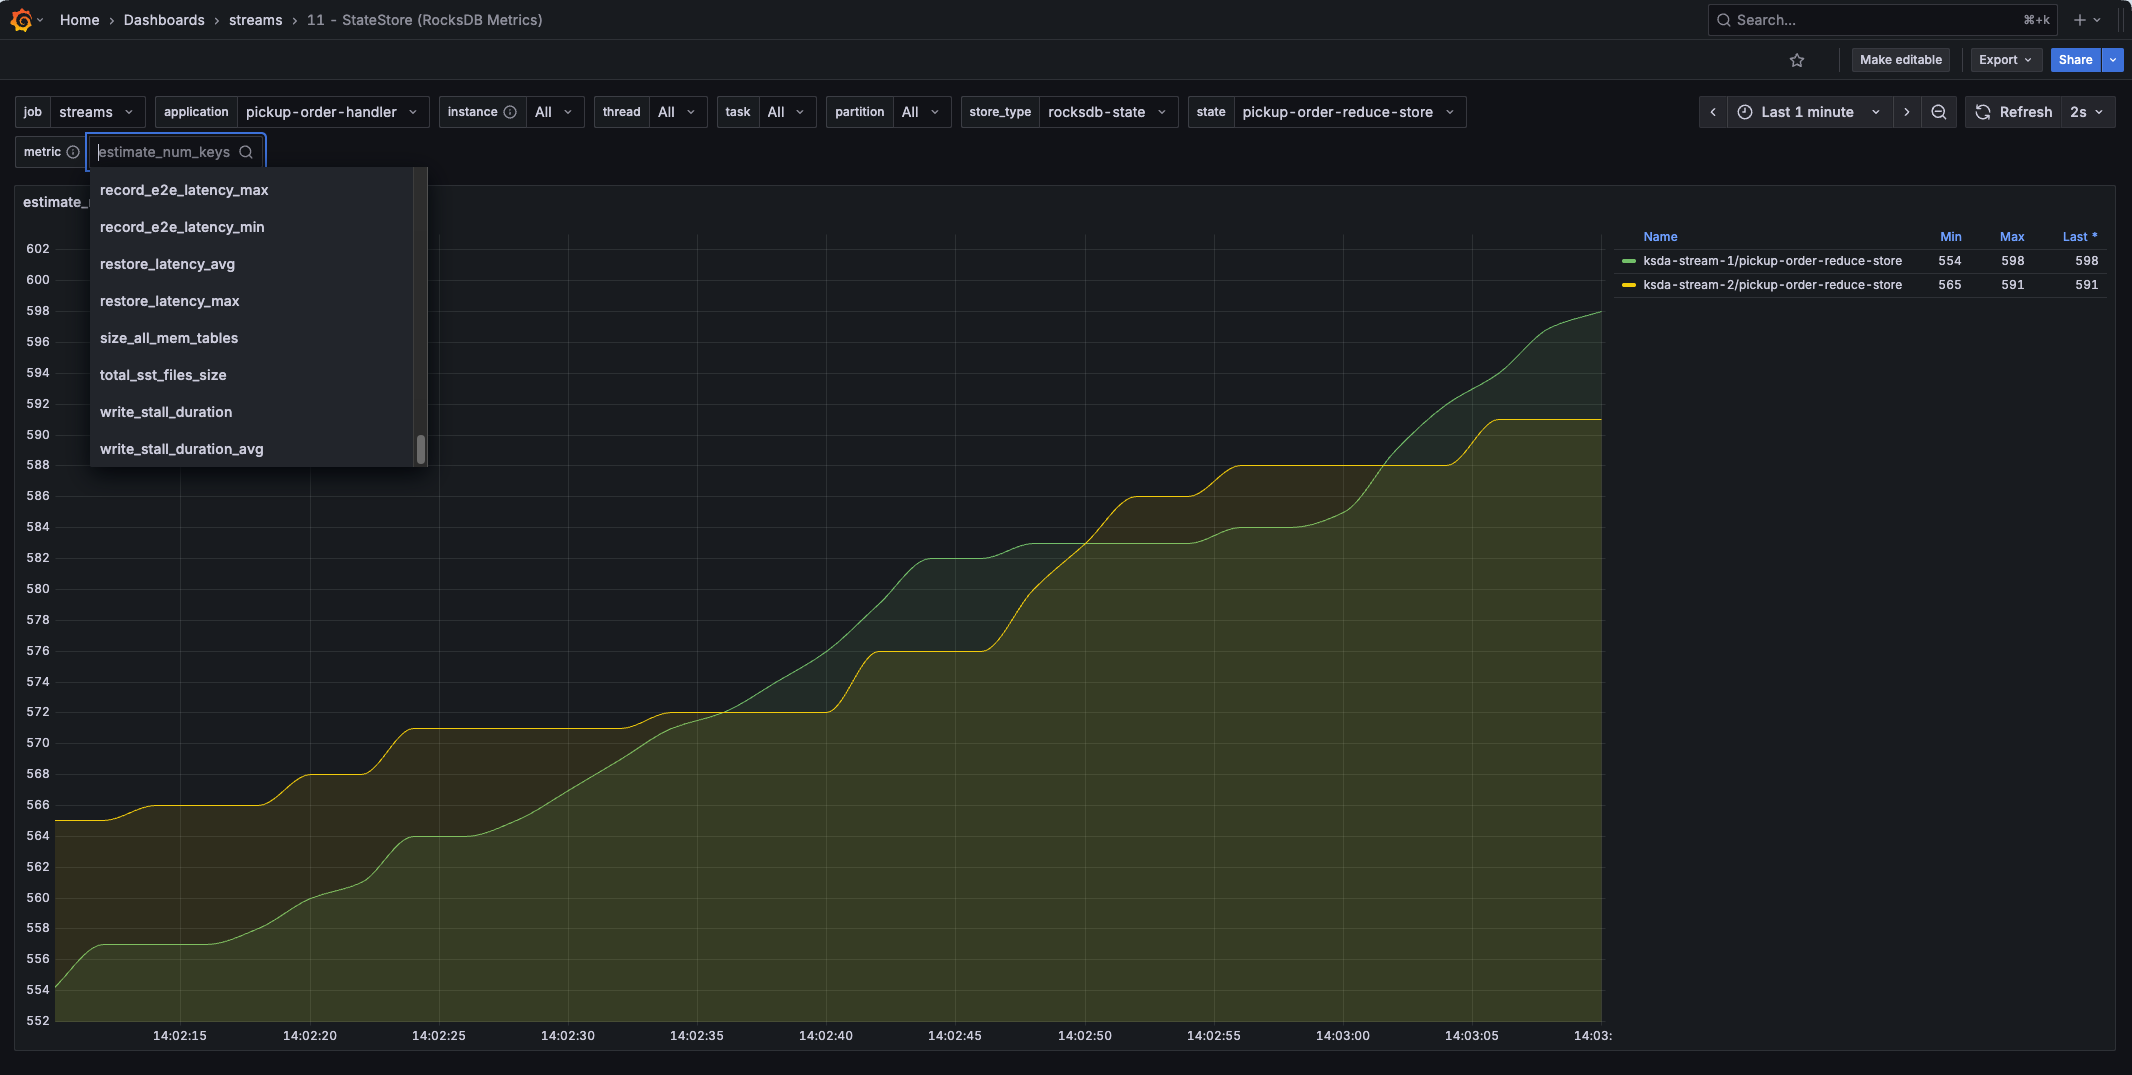 Need deeper insights into the RocksDB state store? This dashboard lets you select any of the (RocksDB) state store metrics, including
 num-open-iterators!
My Core Insights Grafana dashboard
Based on the kineticedge/kafka-streams-dashboards stack, I created my own Grafana dashboard. This dashboard provides core insights into the health of your Kafka Streams application. It’s the first dashboard to open when you need to understand your application or troubleshoot it. More specialized dashboards can be used afterward.
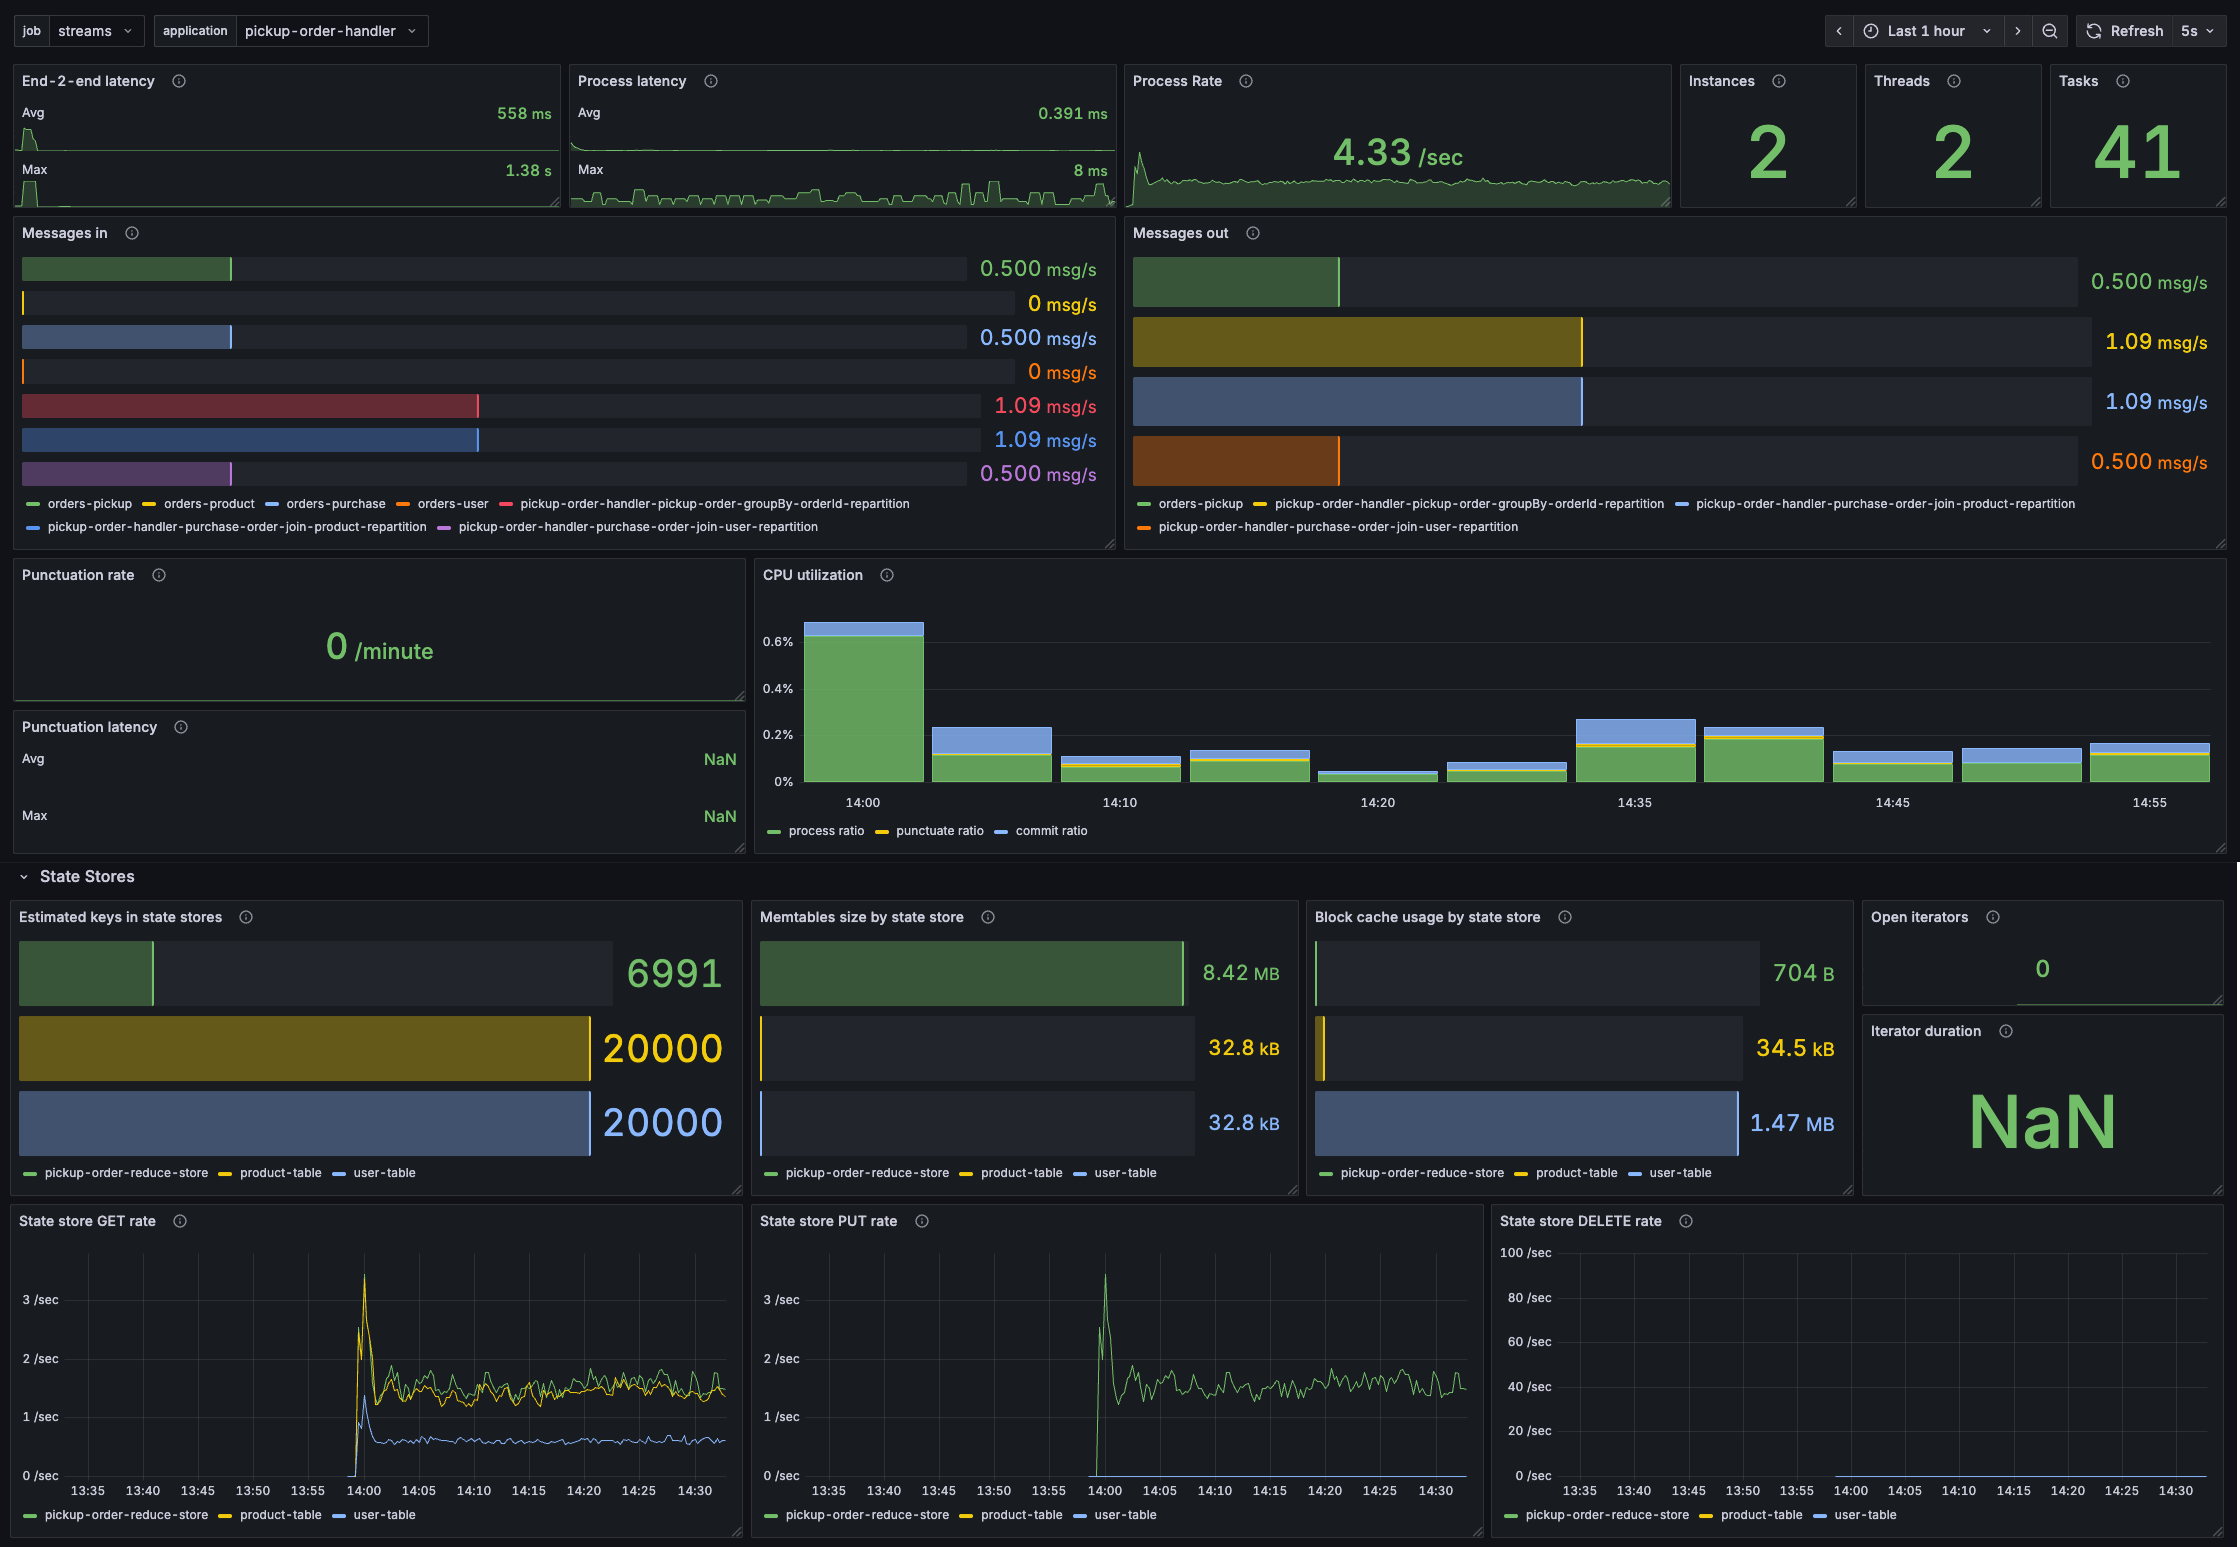
Want to know more? I’ve dedicated an entire post to this dashboard, which you can find here.
Confluent Cloud
If you’re using Confluent Cloud, then you can use its dedicated Kafka Streams dashboard. It nicely integrates key metrics into one view so that you can quickly get an idea of the health of your Kafka Streams application. This post on the Confluent blog gives a good overview of the capabilities.
Monitoring consumer lag
Next to monitoring the Kafka Streams metrics, you also want to monitor the consumer lag. When a Kafka Streams application (or any Kafka consumer in a consumer group) can’t keep up with processing messages from a topic, it keeps building up consumer lag. This means the application either isn’t processing fast enough, or it’s down and not processing messages at all. Needless to say, this is important to monitor.
It’s important to mention that some consumer lag is normal when new messages are being produced. As long as this remains low or is fluctuating, all is fine. If there was a high burst of messages onto the input topic, then expect consumer lag to increase. Once the burst is over, the consumer lag should go down again while Kafka Streams is catching up. If it doesn’t go down or is increasing consistently, then it’s time to investigate.
Static monitoring
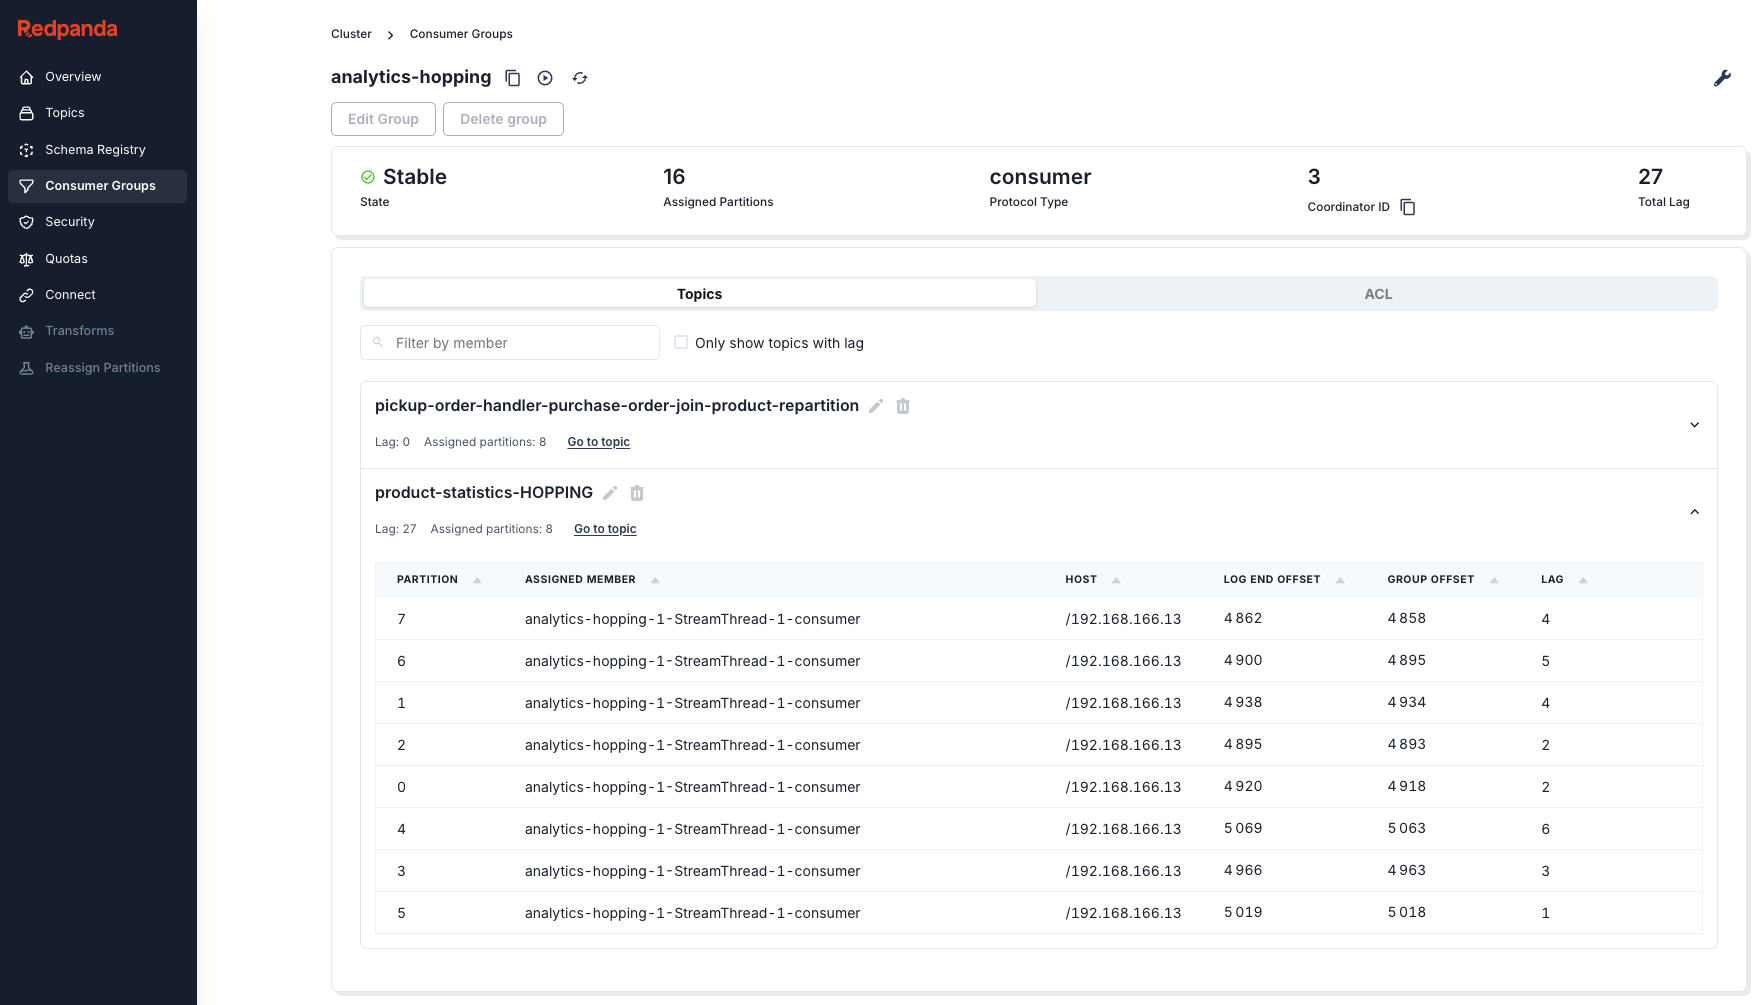
To have a look at the Kafka Streams consumer lag, you can use any of these Kafka UIs. In their consumer group view, select the consumer group of your Kafka Streams application. Most of these are free and open source, but some require a license.
- Redpanda Console - my favorite free UI
- Blazing KRaft
- Kafbat UI
- Kafdrop
- Kpow - my favorite, but quite expensive (per cluster license). Also, the only UI with specific Kafka Streams integration. For this, its Kpow Streams Agent needs to be configured in your application. It can visualize the topology and show Kafka Streams metrics. It can also expose Kafka Streams metrics via Kpow Prometheus endpoints.
- Lenses - license required
- CMAK
- KafkIO
- AKHQ
You can also show the consumer lag in a Grafana dashboard by exporting the consumer group lag metrics to Prometheus using Kafka Exporter or KMinion.
Dynamic monitoring & alerting
While these UIs and dashboards allow you to view the consumer lag, they won’t alert you. But how would you alert on consumer lag? That’s not as straightforward as you might think. As mentioned earlier, having some consumer lag or a temporary spike (e.g., when you have customers with ingestion bursts) typically isn’t an issue. That means configuring an alert on a fixed lag threshold isn’t easy. It would trigger false positives on ingest spikes, or trigger too late on a slowly, consistently increasing lag.
That’s where Burrow comes in, an open source tool that doesn’t rely on fixed thresholds but uses a sliding window to evaluate the consumer group status. This is better, as it can tell the difference between fluctuating and consistently increasing lag (within a sliding window). It automatically monitors all consumers by following the internal __consumer_offsets topic, used by Kafka to log the consumer offsets.
Burrow can alert on consumer lag using its built-in notifiers, either through email or through an outbound HTTP request (e.g., a Slack webhook). It also has a /metrics endpoint for Prometheus scraping and an HTTP API, through which it exposes the consumer group status.
Monitoring logs
Not only metrics are important when monitoring Kafka Streams, but also logs. I’ve detected an issue in a Kafka Streams deployment more than once by looking at the logs. I’ll cover two scenarios here that I’ve encountered and think are worth watching out for.
Member consumer sending LeaveGroup request to coordinator broker-1:29092 because of consumer poll timeout has expired. This means the time between subsequent calls to poll() was longer than the configured max.poll.interval.ms, which typically implies that the poll loop is spending too much time processing messages. You can address this either by increasing max.poll.interval.ms or by reducing the maximum size of batches returned in poll() with max.poll.records.
This log is worth alerting on, as it shows that your application is blocking or mis-configured. It’s one of the most common issues I’ve encountered, especially in bigger applications, and typically requires code changes to fix.
Requesting followup rebalance be scheduled by <> for <> to probe for caught-up replica tasks
Requested to schedule next probing rebalance at <> to try for a more balanced assignment
This log typically shows that your Kafka Streams deployment is waiting for a warmup task to complete before it can migrate a new task to it. It’s the mechanism Kafka Streams uses to transition tasks from one node to another with the least amount of downtime. While this log is not necessarily worth alerting on, it might show that your application is taking a long time to transition tasks. These probes trigger every 10 minutes by default while preparing tasks. So, if you notice these for prolonged periods of time, then you might have to investigate the configuration of your warmup tasks (I’m covering this in my Kafka Streams Field Guide)
Monitor state store restoration progress
When a Kafka Streams state store can’t fall back on its local copy of the state store, then it has to restore the state store from its changelog topic. When you have stateful Kafka Streams applications with large state stores, it might take a while to restore their state on startup. Therefore, it’s useful to monitor the restoration progress. You can do this by implementing a StateRestoreListener and logging the progress.
import com.typesafe.scalalogging.Logger
import org.apache.kafka.common.TopicPartition
import org.apache.kafka.streams.processor.StateRestoreListener

class LoggingStateRestoreListener extends StateRestoreListener {

    private val logger = Logger[LoggingStateRestoreListener]

    override def onRestoreStart(topicPartition: TopicPartition,
                                storeName: String, startingOffset: Long,
                                endingOffset: Long): Unit =
        logger.info(s"Started restoring state store $storeName " +
            s"on partition ${topicPartition.partition()} " +
            s"with ${endingOffset - startingOffset} offsets to be restored")

    override def onBatchRestored(topicPartition: TopicPartition,
                                 storeName: String,
                                 batchEndOffset: Long,
                                 numRestored: Long): Unit =
        logger.info(s"Restored $numRestored records " +
            s"for state store $storeName " +
            s"on partition ${topicPartition.partition()}")

    override def onRestoreEnd(topicPartition: TopicPartition,
                              storeName: String,
                              totalRestored: Long): Unit =
        logger.info(s"Finished restoring state store $storeName " +
            s"on partition ${topicPartition.partition()}")
}
This listener can then be registered on the Kafka Streams instance:
val streams = new KafkaStreams(buildTopology, config)
streams.setGlobalStateRestoreListener(new LoggingStateRestoreListener())
streams.start()Insight 1: Partitioning Strategy
How to size your topics, optimize message distribution, ensure ordering guarantees, and handle co-partitioning and repartitioning.
Insight 2: Rebalance Tuning
Understand warmup tasks and how they impact rebalances. Learn to configure them to reach stable, higher throughput faster.
No fluff. Just straightforward advice and deep insights to improve your Kafka Streams application's performance.